AQA GCSE Biology: Food Chains and Predator-Prey
A clear GCSE Biology revision guide to food chains: producers and consumers, and why predator and prey populations rise and fall in cycles.
Food chains show what eats what, and how energy passes through a community. This guide explains the parts of a food chain and why the numbers of predators and their prey rise and fall in linked cycles. The producers at the start are the source of all the biomass.
Food chains
A food chain shows the feeding relationships in a community, and the arrows show the transfer of energy or biomass from one organism to the next.
- Producers make their own food, usually green plants or algae that make glucose by photosynthesis. Photosynthetic organisms are the producers of biomass (the mass of living material) for life on Earth.
- Primary consumers eat the producers.
- Secondary consumers eat the primary consumers.
- Tertiary consumers eat the secondary consumers.
A predator is a consumer that kills and eats other animals, and its prey is the animal it eats.
The arrow is where marks are lost most often. It does not mean "eats". It points in the direction the energy and biomass travel, which is from the thing being eaten towards the thing eating it. So grass points to rabbit, and rabbit points to fox. Reading a chain aloud as "grass is eaten by rabbit, which is eaten by fox" keeps the arrows the right way round.
Every chain starts with a producer, and it has to. Consumers cannot make biomass, only pass it along, so unless something at the start is capturing light and building glucose there is nothing for the rest of the chain to move. That is why the producer is described as the source of all the biomass for life on Earth, and why a food chain can never begin with an animal.
Chains are also short, rarely more than four or five links. So much biomass is lost at each transfer that there is not enough left to support another level, which is the subject of the trophic levels and biomass guide.
Predator-prey cycles
In a stable community, the numbers of a predator and its prey rise and fall in linked cycles, with the predator's peak coming a little after the prey's.
- As prey numbers rise, predators have more food, so more survive and breed, and predator numbers rise.
- With more predators, more prey are eaten, so prey numbers fall.
- With less food, fewer predators survive and breed, so predator numbers fall.
- With fewer predators, fewer prey are eaten, so prey numbers rise again, and the cycle repeats.
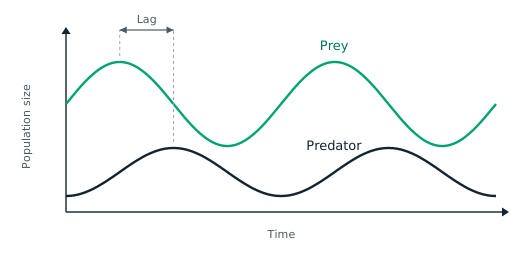
Two things on this graph are worth being able to point at.
- The predator peaks come slightly after the prey peaks, not at the same time. The predators need food before they can breed successfully, so their numbers rise only once the prey numbers already have.
- The predator line stays below the prey line. There are always fewer predators than prey, which is why the predator peaks are smaller as well as later.
The reason the cycle never settles down is that each population is reacting to the last state of the other rather than the current one. By the time predator numbers have risen in response to plentiful prey, the prey are already being eaten faster than they breed. By the time predators starve and decline, the prey have already begun to recover. That delay is what turns what could have been a steady level into a repeating rise and fall.
This pattern is only expected in a stable community, where the two species are each other's main control. Introduce a disease, a second predator or a change in the weather and the cycles break up, which is often what a graph with an irregular section in it is asking you to notice.
How this fits together
Food chains move materials as well as energy through a community, and those materials are recycled endlessly, as explained in the carbon and water cycles guide.