AQA A-Level Biology: Haemoglobin and Oxygen Transport
A clear revision guide to haemoglobin for AQA A-Level Biology: the oxyhaemoglobin dissociation curve, cooperative binding, the Bohr effect, and different types of haemoglobin.
Oxygen does not dissolve well in blood plasma, so almost all of it is carried by a protein: haemoglobin. Understanding how haemoglobin picks up oxygen where there is plenty and releases it where it is needed is one of the most important, and most tested, ideas in this topic.
Red blood cells and haemoglobin
Oxygen is carried inside red blood cells, which are packed with haemoglobin. Red blood cells are adapted for this: they have no nucleus, leaving more room for haemoglobin, and their biconcave shape gives a large surface area to volume ratio and a short diffusion distance for oxygen to enter and leave.
Haemoglobin is a protein with a quaternary structure, made of four polypeptide chains. Each chain holds a haem group containing an iron ion (Fe2+), and each haem group can bind one oxygen molecule, so one haemoglobin molecule carries up to four oxygen molecules. Haemoglobins are a family of similar molecules found across many organisms.
Loading and unloading oxygen
Whether haemoglobin picks up or releases oxygen depends on the partial pressure of oxygen (pO2), which is a measure of oxygen concentration.
- Where pO2 is high, such as at the gas exchange surface in the lungs, haemoglobin has a high affinity for oxygen, so oxygen loads (associates) onto it, forming oxyhaemoglobin. Its percentage saturation is high.
- Where pO2 is low, such as in respiring tissues, haemoglobin has a low affinity for oxygen, so oxygen unloads (dissociates) and is delivered to the cells. Its percentage saturation is low.
So the same molecule behaves in opposite ways in the two places it needs to, simply because the oxygen concentration is different.
The oxyhaemoglobin dissociation curve
A graph of percentage saturation against pO2 is the oxyhaemoglobin dissociation curve, and it is S-shaped (sigmoid). The shape comes from cooperative binding.
When the first oxygen molecule binds, it changes the tertiary and quaternary structure of the haemoglobin slightly, uncovering the other binding sites and making it easier for the next oxygen molecules to bind. This is why the curve is shallow at first (the first oxygen binds slowly) and then rises steeply (once binding has got easier). Near the top it flattens again as the molecule approaches full saturation and there are few sites left.
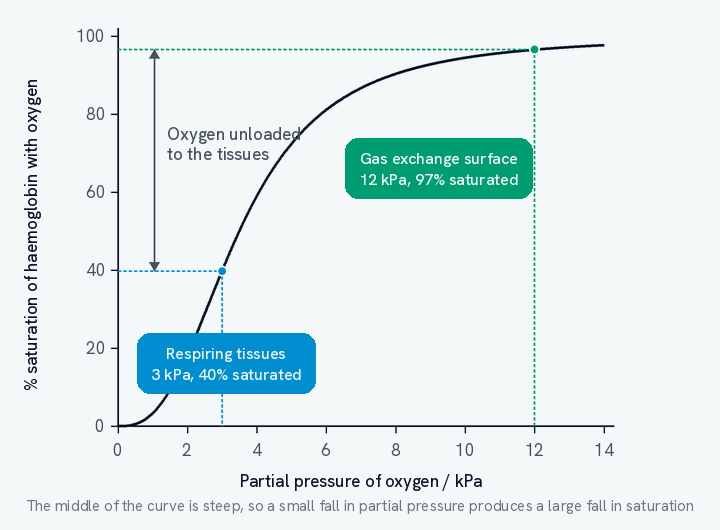
Reading the curve is a skill in its own right, and it is where most of the marks sit. Take the two pressures marked on the graph. At the gas exchange surface, where pO2 is about 12 kPa, haemoglobin is roughly 97% saturated, so blood leaves the lungs almost completely loaded. At a respiring tissue, where pO2 has fallen to about 3 kPa, saturation is only about 40%. The difference between the two, around 57 percentage points, is the oxygen that has been handed over to the tissue.
Notice where on the curve that unloading happens. Both readings sit on the steep middle section, and that is the whole point of the sigmoid shape: a small fall in partial pressure there produces a large fall in saturation. Haemoglobin gives up oxygen most readily at exactly the pressures found in a tissue that has been respiring.
The flat upper section earns its keep too. Once the curve has levelled off, a fall in the pO2 of the lungs makes very little difference to saturation, so the blood still leaves nearly full even if the air is thinner or breathing is shallow.
The Bohr effect
The curve is not fixed. When the concentration of carbon dioxide rises, the whole curve shifts to the right. This is the Bohr effect.
Here is why it happens. A high rate of respiration produces more carbon dioxide, which lowers the pH of the blood (makes it more acidic). The change in pH slightly changes the shape of haemoglobin, reducing its affinity for oxygen. So at any given pO2, haemoglobin holds less oxygen and unloads it more readily.
This is exactly what a respiring tissue needs. During exercise, muscles produce a lot of carbon dioxide, and the Bohr effect makes haemoglobin release more oxygen right where it is being used. More oxygen means more aerobic respiration and less reliance on anaerobic respiration, so more ATP is produced.
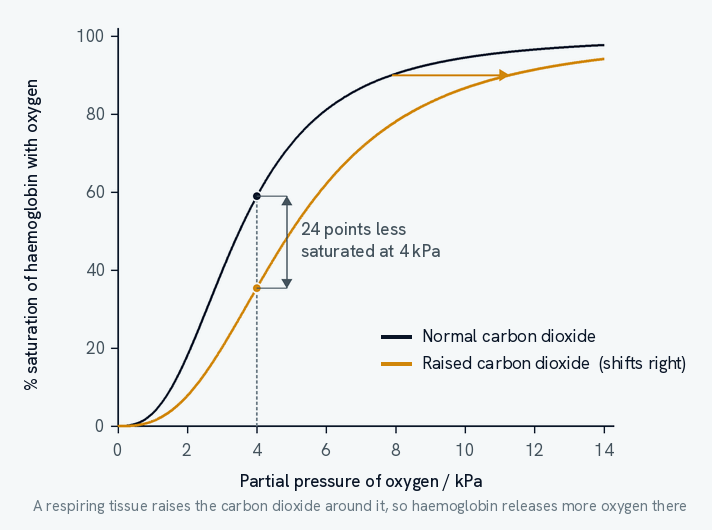
The graph shows the size of the effect. At a pO2 of 4 kPa, haemoglobin in normal conditions is about 59% saturated, but with raised carbon dioxide it is only about 35% saturated. Those 24 percentage points are extra oxygen released to the tissue, and they are released without the oxygen concentration changing at all. The tissue has done nothing but respire, and respiring is what produced the carbon dioxide that caused the shift.
Two points of wording are worth getting exactly right, because both are commonly thrown away.
- The curve shifts, it does not change shape. A rightward shift means a lower saturation at the same partial pressure, not a smaller total capacity. Haemoglobin can still reach full saturation; it simply needs a higher pO2 to do it.
- It is the rise in carbon dioxide, acting through pH, that causes the shift. An answer saying the oxygen concentration fell has described something else entirely, and will not score.
Different haemoglobins for different lives
Not all haemoglobin is the same. Different organisms have haemoglobin made of polypeptide chains with slightly different amino acid sequences, giving slightly different tertiary and quaternary structures and therefore different affinities for oxygen. Their dissociation curves sit in different positions, and this adapts them to their environment.
A curve shifted to the left shows a higher affinity for oxygen: haemoglobin loads oxygen readily even where pO2 is low. This suits organisms living where oxygen is scarce, such as at high altitude, underground, or a foetus taking oxygen from its mother's blood.
A curve shifted to the right shows a lower affinity: haemoglobin unloads oxygen readily at the tissues. This suits small or very active organisms with a high metabolic rate, which need to deliver oxygen to their cells quickly.
Those two sentences are the whole of this topic in miniature, and they are worth learning as a pair: left means loads readily, right means unloads readily. Every example, including the Bohr effect above, is one of those two.
Foetal haemoglobin
A foetus cannot breathe. It takes its oxygen from its mother's blood at the placenta, where the two circulations run close together but never mix, so oxygen can only cross by diffusion. The difficulty is that by the time maternal blood reaches the placenta it has already given up some of its oxygen, so the foetus has to load oxygen from blood at a fairly low pO2.
Foetal haemoglobin has a higher affinity for oxygen than adult haemoglobin, so its dissociation curve lies to the left of the adult one.
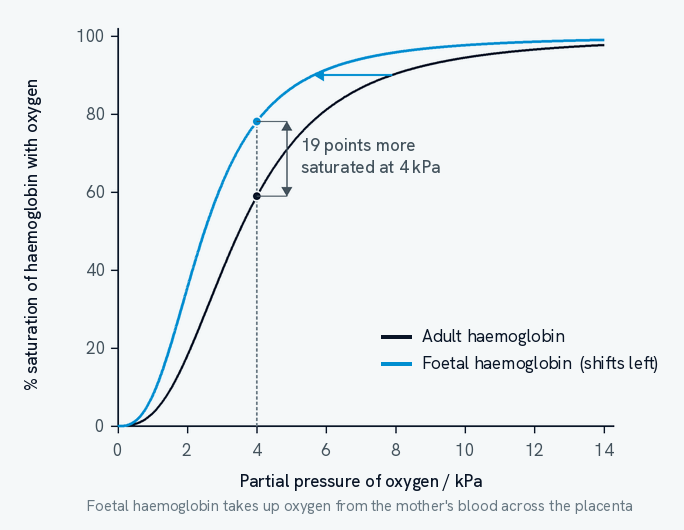
At a pO2 of 4 kPa the mother's haemoglobin is about 59% saturated while the foetus's is about 78% saturated, and the foetal curve sits above the adult one at every partial pressure. So wherever the two bloods come close at the placenta, oxygen leaves the mother's haemoglobin and is taken up by the foetus's.
That difference is the point. If foetal haemoglobin had the same affinity as its mother's, the two would be equally saturated at any given pO2, there would be no net transfer, and the foetus could not take enough oxygen to survive.
Note that this is a difference in the protein, not in the conditions. Foetal haemoglobin has polypeptide chains with a different amino acid sequence from adult haemoglobin, so its tertiary and quaternary structure differs and it binds oxygen more tightly. That is a different mechanism from the Bohr effect, where one and the same haemoglobin changes behaviour because the pH around it has changed.
Once oxygen is loaded onto haemoglobin, it has to be pumped around the body. That is the job of the heart and blood vessels, covered in the heart and circulation guide.